Vue echarts可视化
背景
最近项目中需要用到图形可视化,制作一系列的报表功能,查询资料后使用echarts来实现功能,主要需要实现根据数据渲染多组数据来展现对比数据
实现说明
- 将图形封装为一个基础组件
- 按照对应的数据格式,填充到option中
- 多组数据通过for循环来完成
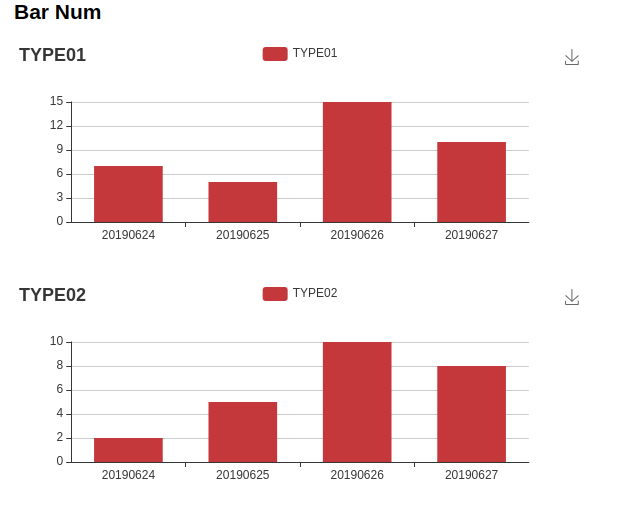
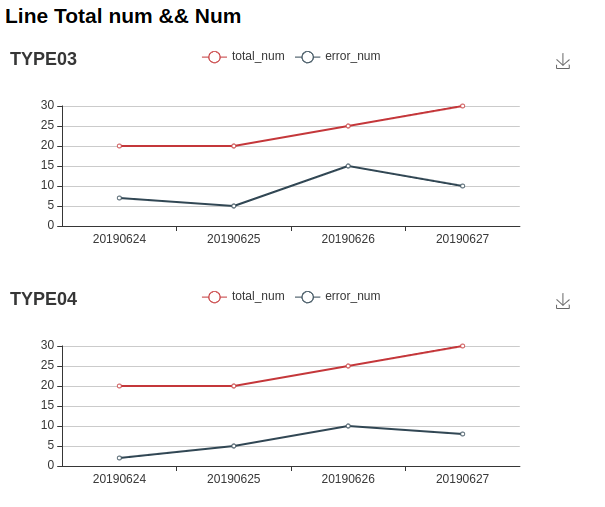
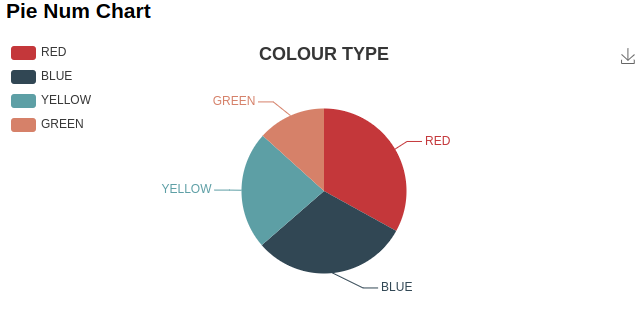
效果图
实例
chart.vue组件
12345678910111213141516171819202122232425262728293031323334353637383940414243444546474849505152535455565758596061626364656667<template><div :id="id" :style="style"></div></template><script>import echarts from 'echarts'export default {name: "Chart",props: {id: {type: String},width: {type: String,default: "100%",},height: {type: String,default: "300px"},option: {type: Object,required: true,}},computed: {style() {return {height: this.height,width: this.width}}},data() {return {chart: ""};},methods: {init() {this.chart = echarts.init(document.getElementById(this.id));// this.chart.showLoading();this.chart.setOption(this.option);// this.chart.hideLoading();window.addEventListener("resize", this.chart.resize);}},mounted: function () {this.init();},watch: {option: {handler(newVal, oldVal) {if (this.chart) {if (newVal) {this.chart.setOption(newVal);} else {this.chart.setOption(oldVal);}} else {this.init();}},deep: true}}}</script>echarts.vue
123456789101112131415161718192021222324252627282930313233343536373839404142434445464748495051525354555657585960616263646566676869707172737475767778798081828384858687888990919293949596979899100101102103104105106107108109110111112113114115116117118119120121122123124125126127128129130131132133134135136137138139140141142143144145146147148149150151152153154155156157158159160161162163164165166167168169170171172173174175176177178179180181182183184185186187188189190191192193194195196197198199200201202203204205206207208209210211212213214215216217218219220221222223224<style scoped lang="less"></style><template><div><h2>Bar Num</h2><div v-for="(item,index) in optionData" :key="item.series.name"><Chart :id="item.series.name" :option="item" :width="item._width" :height="item._height"></Chart></div><h2>Line Total num && Num</h2><div v-for="(item,index) in optionAllData" :key="item.title.text"><Chart :id="item.title.text" :option="item" :width="item._width" :height="item._height"></Chart></div><h2> Pie Num Chart</h2><Chart :id="pieOption.title.text" :option="pieOption" :width="pieOption._width" :height="pieOption._height"></Chart></div></template><script>import Chart from './Chart.vue'export default {name: 'echarts',components: {Chart},data() {return {// 模拟后端返回的数据dateTime: ["20190624", "20190625", "20190626", "20190627"],selectObject: {'TYPE01': [7, 5, 15, 10],'TYPE02': [2, 5, 10, 8],},selectAllObject: {'TYPE03':{'total_num': [20, 20, 25, 30],'error_num': [3, 5, 5, 10]},'TYPE04': {'total_num': [20, 20, 25, 30],'error_num': [2, 5, 15, 8]}},optionData: [],optionAllData: [],// Pie数据pieOption: {title : {text: 'COLOUR TYPE',// subtext: '-',x:'center'},tooltip : {trigger: 'item',formatter: "{a} <br/>{b} : {c} ({d}%)"},legend: {orient: 'vertical',left: 'left',data: ['RED','BLUE','YELLOW','GREEN']},// 保存为图片设置toolbox: {show: true,feature: {saveAsImage: {show:true,title: 'Save image',excludeComponents :['toolbox'],pixelRatio: 2}}},series : [{name: 'COLOUR TYPE',type: 'pie',radius : '55%',center: ['50%', '50%'],data:[{value:335, name:'RED'},{value:310, name:'BLUE'},{value:234, name:'YELLOW'},{value:135, name:'GREEN'},],itemStyle: {emphasis: {shadowBlur: 10,shadowOffsetX: 0,shadowColor: 'rgba(0, 0, 0, 0.5)'}}}],_width: "50%",_height: '300px'},}},created() {this.initData();this.initAllData();},methods: {initData() {let item_list = Object.keys(this.selectObject);item_list.forEach((key)=>{this.optionData.push({title: {text: key},toolbox: {show: true,feature: {saveAsImage: {show:true,title: 'Save image',excludeComponents :['toolbox'],pixelRatio: 2}}},tooltip: {trigger: 'axis',axisPointer: { // 坐标轴指示器,坐标轴触发有效type: 'line', // 默认为直线,可选为:'line' | 'shadow'}},legend: {data: [key]},xAxis: [{type: 'category',data: this.dateTime,axisTick: {alignWithLable: true}},],yAxis: [{type: "value"}],series: {name: key,type: "bar", // bar, linedata: this.selectObject[key],barWidth: '60%'},_width: "45%",_height: '240px'})})},initAllData() {let item_list = Object.keys(this.selectAllObject);item_list.forEach((key)=>{let type_list = Object.keys(this.selectAllObject[key]);this.optionAllData.push({title: {text: key},toolbox: {show: true,feature: {saveAsImage: {show:true,title: 'Save image',excludeComponents :['toolbox'],pixelRatio: 2}}},tooltip: {trigger: 'axis',axisPointer: { // 坐标轴指示器,坐标轴触发有效type: 'line', // 默认为直线,可选为:'line' | 'shadow'}},legend: {data: type_list,},xAxis: [{type: 'category',data: this.dateTime,axisTick: {alignWithLable: true}},],yAxis: [{type: "value"}],series: [{name: type_list[0],type: "line", // bar, linedata: this.selectAllObject[key][type_list[0]],barWidth: '60%'},{name: type_list[1],type: "line", // bar, linedata: this.selectAllObject[key][type_list[1]],barWidth: '60%'}],_width: "45%",_height: '240px'})})},}}</script>